Is your Windows PC feeling sluggish? Applications taking forever to open, or games stuttering more than usual? Before you panic, the Windows Task Manager is your first stop for a quick diagnosis. It’s a built-in tool that provides a real-time snapshot of your system’s resource usage, helping you pinpoint what might be slowing things down. This guide will walk you through exactly how to use Task Manager to check your system’s performance.
What is Windows Task Manager?
Windows Task Manager is a powerful utility that provides information about processes, performance, app history, startup programs, users, and services running on your computer. It’s a crucial tool for troubleshooting performance issues, ending unresponsive programs, and managing startup applications.
How to Open Task Manager
There are several quick ways to open Task Manager:
- Keyboard Shortcut (Recommended): The fastest way is to press Ctrl + Shift + Esc simultaneously.
- Ctrl + Alt + Del: Pressing Ctrl + Alt + Del brings up a security screen, where you can then select “Task Manager.”
- Start Button Right-Click: Right-click on the Start button (or press Windows key + X) and select “Task Manager” from the power user menu.
- Search Bar: Type “Task Manager” into the Windows search bar and click on the “Task Manager” app in the results.
Navigating the Task Manager for Performance Checks
Once you open Task Manager, you’ll likely see a simplified view. Click on “More details” at the bottom left to expand it and reveal all its powerful tabs. For checking system performance, we’ll focus primarily on the “Performance” tab and briefly touch upon the “Processes” tab.
- The Processes Tab: Identifying Resource Hogs
While the Performance tab gives you an overview, the Processes tab is where you identify which specific applications or background processes are consuming your resources.
Steps:
- Open Task Manager and click on “More details.”
- Select the “Processes” tab.
- Here, you’ll see a list of applications and background processes currently running.
- Sort by Resource Usage: Click on the “CPU,” “Memory,” “Disk,” or “Network” column headers to sort the list by their usage.
- CPU: Shows how much processing power each program is using. High CPU usage by an unexpected program can indicate an issue.
- Memory: Displays the RAM each program consumes. If your memory usage is consistently high, you might need more RAM or fewer programs running simultaneously.
- Disk: Indicates how much your hard drive or SSD is being accessed. High disk usage often points to a program constantly reading or writing data, which can slow down your system.
- Network: Shows network activity. Useful if your internet feels slow and you suspect a program is hogging bandwidth.
Tip: If you identify a program consuming an excessive amount of resources and it’s unresponsive or unnecessary, you can select it and click “End task” at the bottom right. Be cautious when ending tasks, especially for unknown background processes, as it could lead to system instability.
- The Performance Tab: A Detailed System Overview
The Performance tab is your go-to for a comprehensive, real-time overview of your system’s hardware. It features graphs and statistics for your CPU, Memory, Disk, and Network.
Steps:
- Open Task Manager and click on “More details.”
- Select the “Performance” tab.
Understanding the Graphs and Metrics:
- CPU (Central Processing Unit):
- Graph: Shows the percentage of CPU utilization over time. Spikes indicate intense processing.
- Metrics: Look at “Utilization” (overall CPU usage), “Speed,” “Processes,” “Threads,” and “Handles.” High “Utilization” consistently means your CPU is working hard.
- What to look for: If your CPU is constantly near 100% even when idle, it suggests a problem or a very demanding background task.
- Memory (RAM – Random Access Memory):
- Graph: Displays memory usage over time.
- Metrics: Key metrics include “In use (Compressed),” “Available,” “Committed,” “Cached,” and “Paged pool.”
- What to look for: High “In use” coupled with low “Available” memory indicates that your system is running out of RAM. This often leads to your computer using virtual memory (page file on the disk), which is much slower and contributes to overall slowdowns. If this is consistently high, consider closing unused applications or upgrading your RAM.
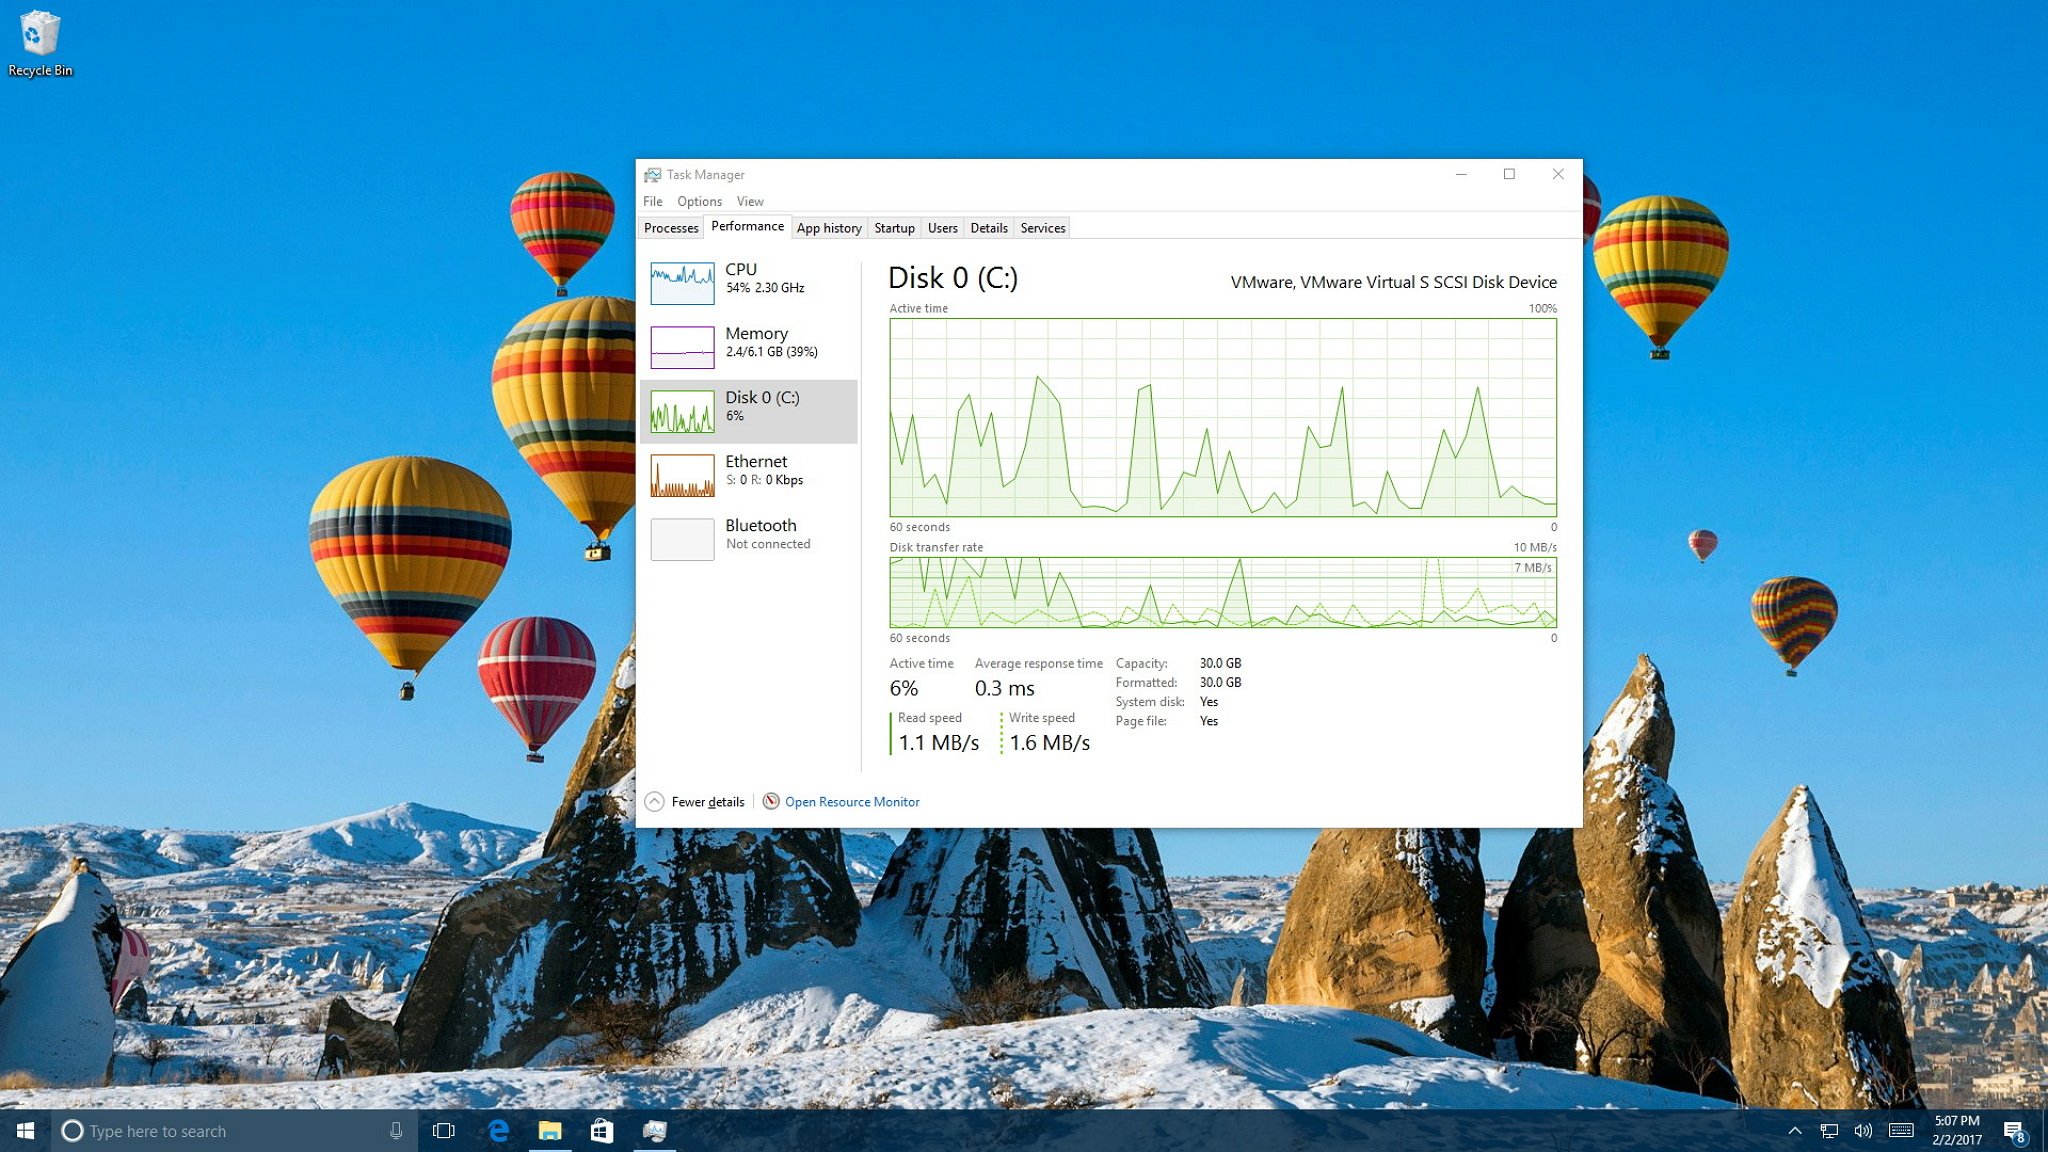
- Disk (Hard Drive/SSD):
- Graph: Shows disk activity (read and write speeds).
- Metrics: “Active time” (percentage of time the disk is busy), “Disk transfer rate” (read/write speeds).
- What to look for: Consistently high “Active time” (near 100%) suggests a disk bottleneck. This can happen during large file transfers, system updates, or if a program is constantly accessing the disk. It’s particularly noticeable on older Hard Disk Drives (HDDs). An upgrade to an SSD can drastically improve disk performance.
- Ethernet/Wi-Fi (Network):
- Graph: Shows network activity (sent and received data).
- Metrics: “Send” and “Receive” speeds.
- What to look for: High network usage when you’re not actively downloading or streaming might indicate background updates, file syncing, or even malware.
Advanced Performance Monitoring
For even more detailed insights, the Performance tab offers a few extra features:
- Open Resource Monitor: At the bottom of the Performance tab, click “Open Resource Monitor.” This tool provides a much more granular view of CPU, Disk, Network, and Memory usage by individual processes, allowing for deeper troubleshooting. It can show you exactly which files a program is accessing on your disk or which network connections are active.
- View Graphs: You can click on the individual resource names (CPU, Memory, Disk, etc.) on the left pane to view larger, more detailed graphs.
When to Worry and What to Do Next
Understanding these metrics helps you identify potential bottlenecks:
- Consistently High CPU Usage: If a single application or a background process is constantly at 80-100% CPU, it’s a major performance drain. Try restarting the application or, if persistent, investigating if it’s a buggy program or malware.
- Low Available Memory (RAM): If your “Available” memory is consistently very low (e.g., less than 1GB on an 8GB system), your system will heavily rely on the page file, leading to significant slowdowns. Close unnecessary programs, or consider adding more RAM.
- 100% Disk Usage: This is a common complaint, especially with HDDs. It can be caused by Windows Update, antivirus scans, or specific applications. Check the Processes tab to identify the culprit. If it’s a persistent issue, an SSD upgrade is often the most effective solution.
- Unexpected Network Activity: If your internet feels slow and Task Manager shows high network usage without you actively doing anything, investigate processes using the network or run a malware scan.
Conclusion
The Windows Task Manager is an invaluable tool for any Windows user. By understanding its “Processes” and “Performance” tabs, you can quickly diagnose common performance issues and take steps to optimize your system. Regular checks can help you keep your PC running smoothly and identify potential problems before they become major headaches. Remember, a little understanding of your system’s resource usage goes a long way in maintaining a fast and responsive computer.